About Investment Reports Dashboard
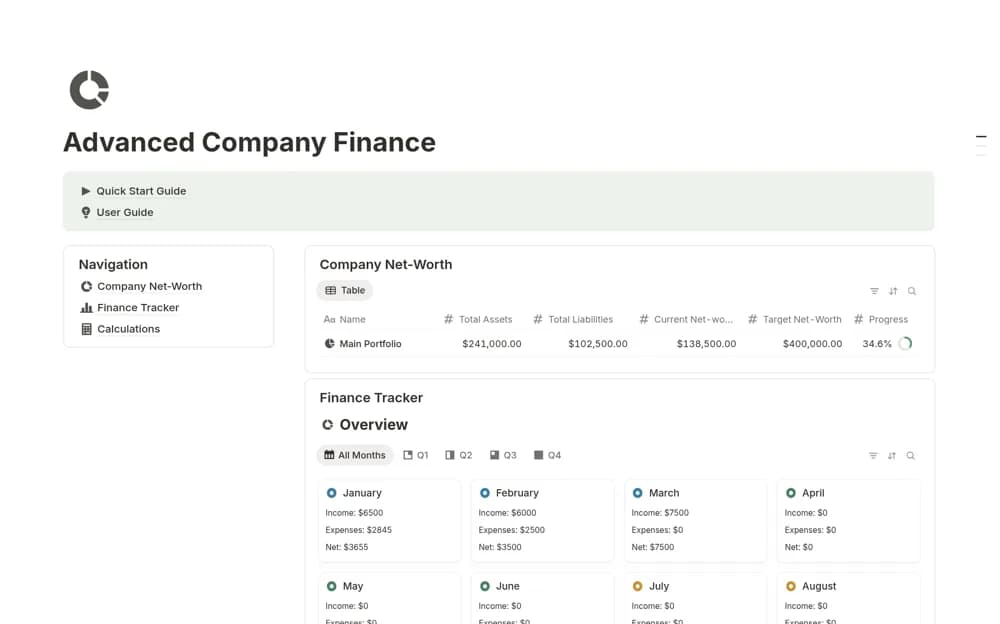
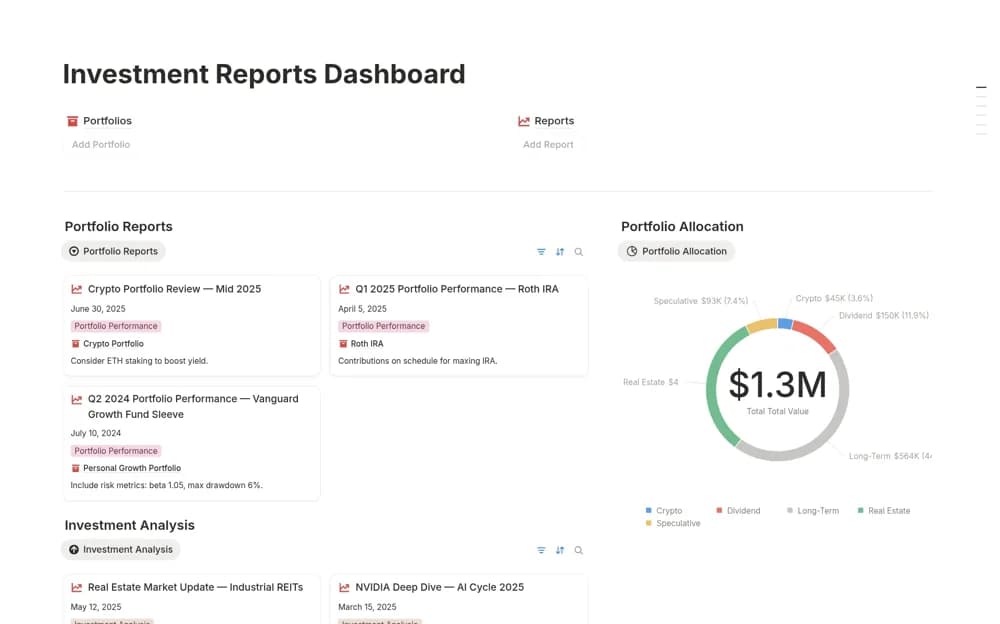
An investment reporting dashboard connecting portfolio records, periodic analyses, performance views, and ROI charts.
What’s included
- Connected Reports and Portfolios databases
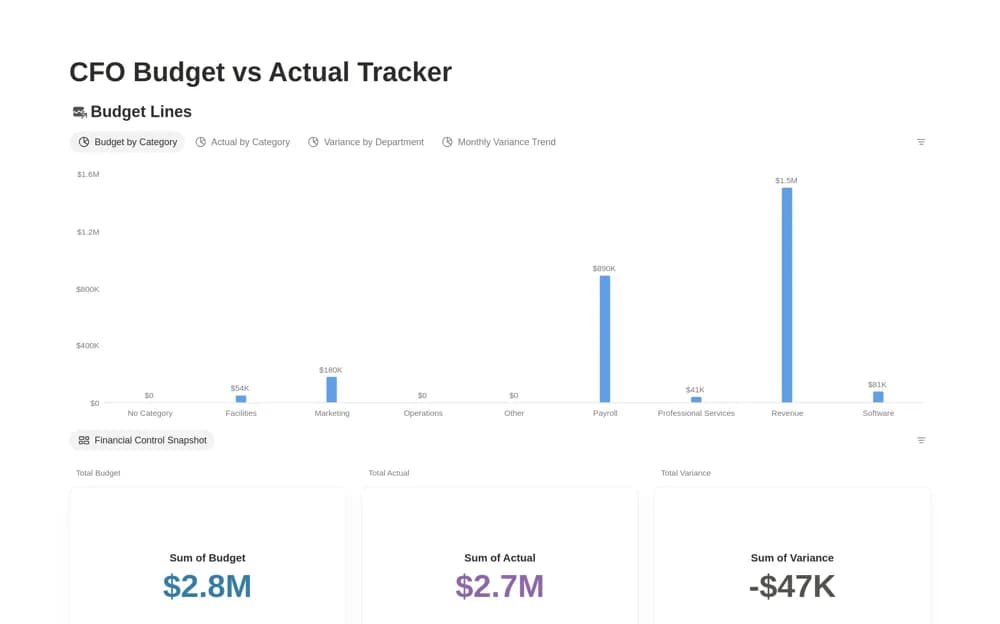
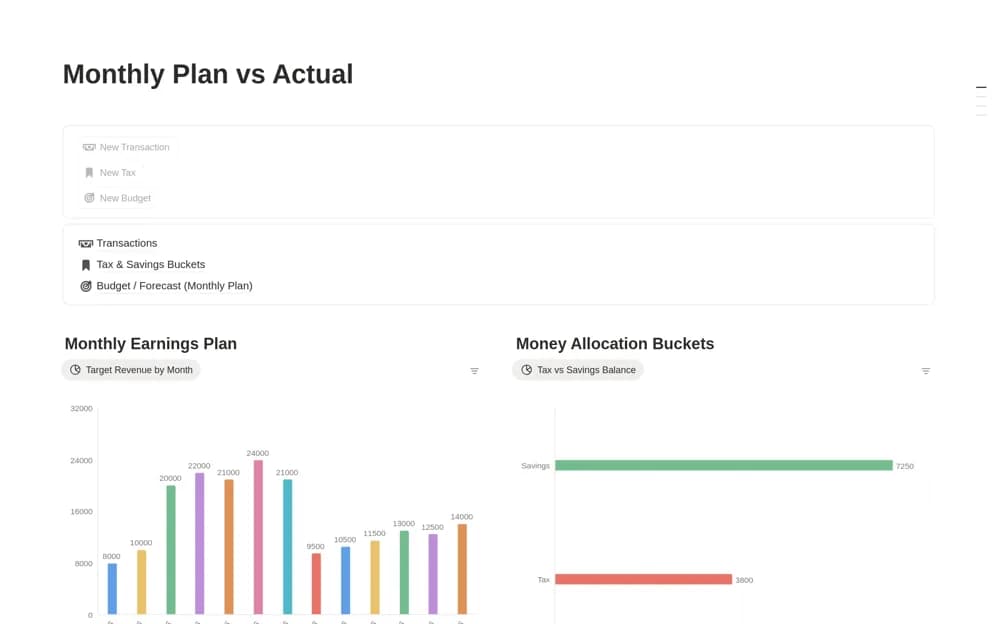
- Performance and summary views
- ROI charts and example monthly or quarterly reports
How to use it in practice
Add a report with its source date, portfolio, and calculation assumptions. Compare a known period with the original statement before using the chart. Keep realized results, estimates, fees, and currency effects clearly distinguished when interpreting the summary.
Set it up in your workspace
- Open the original Notion Marketplace listing and add the template to your chosen workspace while signed in. Keep its example records until you understand how the pages connect.
- Add a report with its source date, portfolio, and calculation assumptions.
- Try one complete example before adding a large backlog. Check that its views and any calculations show what you expect, then replace the sample content with your own.
Who it suits and what to consider
People organizing their own investment reports or analysis references. The dashboard organizes supplied analysis; it does not establish live market data, verified returns, or investment advice.